Data Visualization
Over its long history of providing GIS Services, Stone has extensive experience completing a diverse range of GIS Mapping projects. Through this experience, we have developed unique capabilities in data representation and visualization through the development of map figures, 3D representations, and web-based story maps. Carefully designed maps can help to convey complex data and relationships in an easy to understand manner. Well-crafted data visualizations can help your organization discover actionable insights, collaborate with stakeholders, and communicate with the public.
The following is a listing of our map services:
- Story mapping
- 3D visualization
- Infographics
- Map templates
-
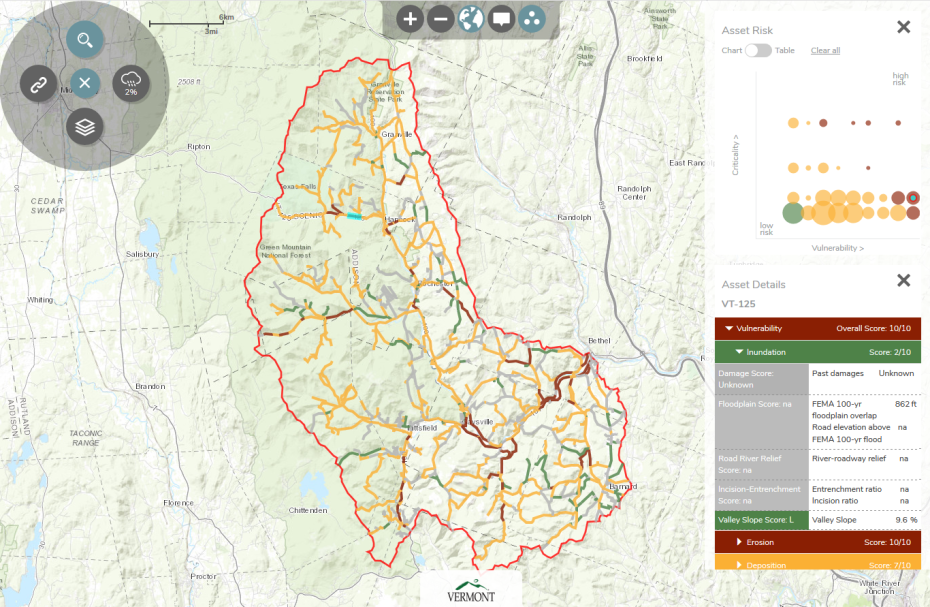
Stone developed the Vermont Transportation Resilience Planning Tool (TRPT), a web-based application designed to help integrate climate risk and transportation resiliency into VTrans’ planning process and ultimately create a more resilient transportation network in Vermont. The TRPT combines river science, hydraulics and transportation planning methods to help VTrans and project partners understand the vulnerability of their transportation systems and mitigate the impacts of climate change and extreme weather Visit https://roadfloodresilience.vermont.gov/#/map
-

Stone Received the Best Use of Story Maps Award at the 2017 Esri Conference
The Award recognizes Stone’s capabilities in data representation and visualization through our creative use of story maps to support area-wide planning efforts. The award was accepted on March 6, 2017 at Esri's conference in Palm Springs, California, by David Healy, Vice President and Senior GIS Applications Specialist of Stone.